
The stock is facing key technical levels in the short term. The range between $65 and $67 is the hurdle to overcome. Its breakthrough on daily closing prices would confirm a new bullish continuation signal that could quickly propel it towards the bearish breakout gap from early 2022 around the $80 zone. Once there, Shopify should attempt to invalidate this bearish pattern with a clear daily close well above the $90 zone, an event that, if consolidated on the weekly chart, would confirm a new large-scale bullish reversal pattern. Another important detail to highlight is that the stock has confirmed a bullish triple moving average crossover (30, 50, and 200 sessions), indicating structural trend strength..
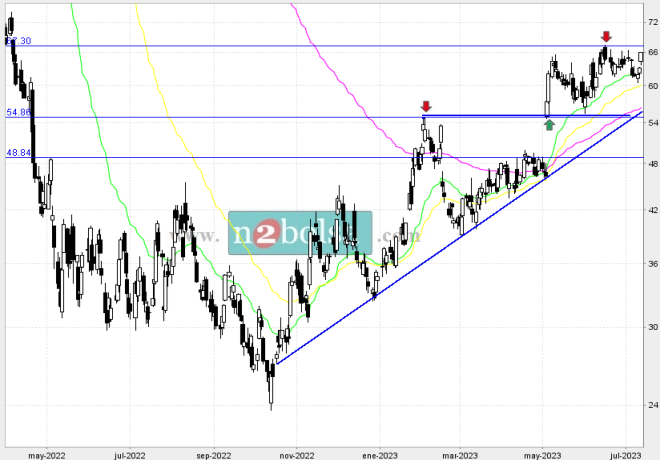
On the downside, the $62 and $56 zones are the levels to watch. The definitive loss of the latter would trigger the breach of its short-term downtrend line, which could incentivize the start of a corrective move towards the lower part of the bullish breakout gap from early May, driven by strong quarterly results, namely the $48 zone. In conclusion, this stock is a candidate for significant movements in the upcoming sessions.
Supports: 62, 56, 50, 28 dollars.
Resistance: 65-67, 80, 90, 120 dollars.
Targets: (bullish) 80, 90, 110, 140 (bearish) 50, 48, 42 zonal dollars.